Data Services (BODS) does not offer the most useful insight into job execution statistics. Even worse, there’s no overview of future job executions, unless you look at the individual schedules and calculate it yourself (or look at past executions to guide you).
By extracting schedule information and combining this with historic execution data (both available in the repository), we can generate reliable estimates for future schedule executions.
The following data is available in the BODS repository:
AL_SCHED_INFO: contains schedule definitions, including recurrence patterns necessary to determine future executions.AL_LANG: contains all the BODS jobs defined in the repository.AL_HISTORY: contains the historical executions and can be used to estimate the duration of future executions based on past data.
If you would like more information on the metadata available in the BODS repository, have a look at the Reference Manual, specifically the chapter Metadata in Repository Tables and Views. (all manuals are available on the SAP Help Portal). There’s also some information available on DWBI.org:
- Data Services Metadata Query Part 1
- Data Services Metadata Query Part 2
- Data Services Metadata Query Part 3
The recurrence pattern is a bitmask stored in AL_SCHED_INFO.RECURRENCE_PATTERN. I couldn’t find any official documentation explaining the meaning behind it, but the SCN wiki article “Understanding schedule pattern in AL_SCHED_INFO table” explains it very well.
To retrieve the active schedules from the AL_SCHED_INFO, along with the name of the job (the table only contains the name of the schedule), you can use the following SQL statement (MSSQL syntax):
SELECT   l.name as job_name,
         s.sched_name as sched_name,
         s.START_TIME as sched_start_dt,
         s.RECURRENCE_TYPE as sched_recur_type,
         s.RECURRENCE_PATTERN as sched_recur_patt
FROM     dbo.AL_SCHED_INFO s
         inner join dbo.AL_LANG l on (s.job_guid = l.guid)
WHERE    s.active = 1
AND      l.TYPE = 0
AND      l.object_type = 0
Given the data retrieved from the repository, here’s how we can calculate the execution days in Python:
MASK = pow(2,31)
pattern =-2147483521 # stored in AL_SCHED_INFO.RECURRENCE_PATTERN
print([day for day, val in enumerate(reversed(bin(MASK + pattern)), start=1) if val == '1' and day<31])
This will return [1, 2, 3, 4, 5, 6, 7], meaning every day of the week (the RECURRENCE_TYPE was WEEKLY in this case).
To further calculate the forecasts and generate the actual start dates (and times) you could opt to use the excellent dateutil Python library.
For example:
# start_dt contains the value of AL_SCHED_INFO.START_TIME
# recur_type contains the value of AL_SCHED_INFO.RECURRENCE_TYPE
# recur_patt contains the value of AL_SCHED_INFO.RECURRENCE_PATTERN

# Calculate 7 days in the future
days = set(day for day, val in enumerate(reversed(bin(RECUR_MASK + recur_patt)), start=0) if val == '1' and day < 31)
recur_rule = rrule(WEEKLY if recur_type == 'WEEKLY' else MONTHLY,
                   byweekday=days if recur_type == 'WEEKLY' else None,
                   bymonthday=None if recur_type == 'WEEKLY' else days,
                   byhour=start_dt.hour,
                   byminute=start_dt.minute,
                   bysecond=start_dt.second,
                   until=datetime.now() + relativedelta(days=7)
It’s hard to predict how long a job will take, as there are a lot of contributing factors. One straightforward approach is to use the past as a guideline. By using the information in the AL_HISTORY table, you can retrieve the records for all successful executions (STATUS = 'D') and calculate the median value for each job (the executions times are stored in seconds).
SELECT   SERVICE as job_name,
         CAST(execution_time as INT) as exec_time
FROM     dbo.AL_HISTORY
WHERE    STATUS = 'D'
AND      EXECUTION_TIME > 0
Note: if you have parameters on job level which influence the execution time (e.g. a full or an incremental load parameter), then the execution estimate will be skewed, as only the job name is taken into account in this example.
You can now calculate the end datetime by adding the calculated median execution time to the start datetime returned by rrule.
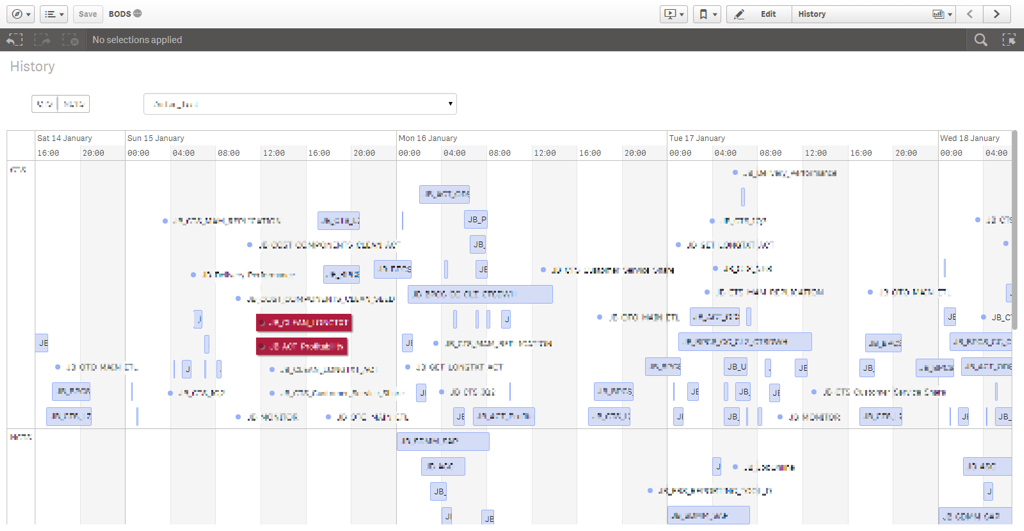
If you want to take it one step further, you could use a dashboarding tool and import your data. This allows you to visualize job executions, which will give you a lot more insight than the job execution history in BODS.
I’ve created a Qlik Sense dashboard, importing the historical data directly from the BODS repository. The forecasts (which have to be calculated by Python first) are written to a local SQLite database and imported into Qlik Sense by using the SQLite ODBC driver.
Thanks to the Qlik Sense interactive Timeline extension, I can visually plot the jobs executions on a timeline. And by using the EXECUTE statement in Qlik Sense, the Python script can be executed every time we reload the data, providing us with up to date historical and forecast data.
The image below is redacted somewhat (for obvious reasons), but it gives you an idea of what the end result could look like.